Public figures for an AI agent implementation range from $2,000 to $400,000, which tells a buyer nothing. Underneath every European quote there is one number that is actually published: what an hour of technical labour costs in that country. Eurostat puts it at €48.20 an hour across the EU in 2025, and between €24.00 in Bulgaria and €71.70 in Ireland. That is not the price. It is the floor the price is built on, and knowing it changes what you can ask a supplier.
A supplier sends you a number. You have nothing to compare it against, so you search, and you find that an AI agent implementation costs somewhere between $2,000 and $400,000. Two of the pages ranking for that question today advertise "$2K–$65K" and "$8K–$400K" for what sounds like the same work.
That range is useless, and it is not an accident.
There is one number underneath every European quote that is genuinely published: what an hour of technical labour costs where the work is done. Eurostat measures it, by country, every year. In 2025 it was €48.20 an hour across the EU for the information and communication sector — and between €24.00 in Bulgaria and €71.70 in Ireland.
That is not what you will be charged. It is the floor the charge is built on. Knowing it is the difference between accepting a number and interrogating one.
Why the published figures disagree by fifty times
The ranges you find are not lies. They are answers to different questions, presented as answers to the same one.
A "$2,000 AI agent" is usually a single automation on an existing no-code platform — one trigger, one action, no integration with your systems, no approval step, no one maintaining it. A "$400,000 AI agent" is a multi-system deployment inside a large company with procurement, security review and a support contract. Both are real. Neither is a price for the thing a ten-person business is actually buying.
What is almost always missing from the advertised range is the scope it prices. Once scope is unstated, the number carries no information — and because the pages publishing these ranges are written by companies selling the work, none of them has an incentive to narrow it.
Averaging those advertised ranges would produce a number describing no real project. The useful move is to go underneath them, to the input cost every supplier in a given country pays for the same hour of work.
What an hour of implementation work costs across Europe
Eurostat's labour cost dataset covers NACE section J — information and communication — which is where implementation work sits. These are employer costs per hour: wages plus employment taxes, minus subsidies. Figures are for 2025, in euros.
| Country | Hourly labour cost |
|---|---|
| Ireland | €71.70 |
| Denmark | €63.50 |
| Luxembourg | €63.10 |
| Sweden | €62.50 |
| Austria | €61.60 |
| France | €59.20 |
| Germany | €58.50 |
| Finland | €51.10 |
| EU-27 average | €48.20 |
| Cyprus | €39.30 |
| Estonia | €38.40 |
| Italy | €38.40 |
| Slovenia | €38.30 |
| Czechia | €34.90 |
| Spain | €34.80 |
| Lithuania | €32.00 |
| Slovakia | €30.80 |
| Croatia | €30.10 |
| Poland | €29.30 |
| Portugal | €28.20 |
| Latvia | €27.80 |
| Romania | €26.00 |
| Greece | €25.80 |
| Hungary | €24.40 |
| Malta | €24.20 |
| Bulgaria | €24.00 |
The spread across the EU is close to threefold. An hour of the same category of work carries €71.70 of employer cost in Ireland and €24.00 in Bulgaria.
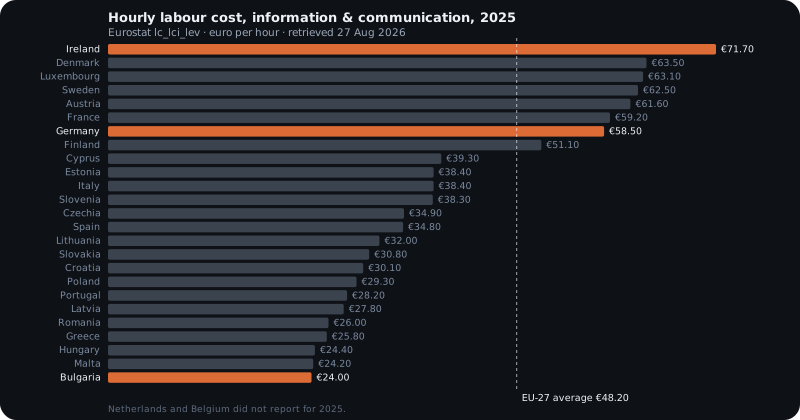
Two things are worth noting about this table before you use it.
Two member states are missing. The Netherlands and Belgium did not report to this dataset for 2025. Their 2024 figures were €58.00 and €58.70 — both would have sat just below Germany — but those are a different year and are not carried into the table above, because quietly mixing years is how comparison tables start lying.
These are sector figures, not agent-specialist figures. Information and communication covers everyone from a telecoms technician to a machine learning engineer. Someone who can scope an agent against your CRM sits above the sector average, not at it.
What this table is not
The Eurostat figures are not a price list, and treating them as one will mislead you badly.
Eurostat measures employer labour cost. A supplier's quote contains that plus overhead, sales cost, tooling, risk and margin — none of which can be derived from this data. The table tells you the floor, never the price.
Eurostat measures what it costs an employer to have someone on the payroll for an hour. A supplier's quote contains that, and then contains everything else: the hours nobody bills you for, sales and account management, tooling and hosting, the risk that the integration takes twice as long as expected, and margin. A working rule in professional services is that a billable rate is a multiple of the underlying labour cost, not a markup on it.
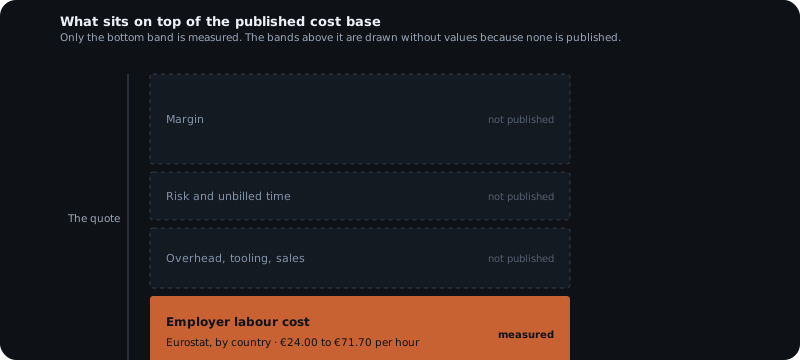
The table also cannot tell you how many hours your project needs. That is a scoping question, and it is where the real variation lives — far more than geography.
Published evidence supports a European cost base. It does not support a European price.
So the honest position is this: published evidence supports a European cost base, and does not support a European price. Anyone giving you a confident single figure for what an AI agent implementation costs is either describing one project they did, or selling.
There is one more distortion worth knowing about. Non-wage costs — employment taxes and social contributions — were 24.8% of total labour cost across the EU in 2025, but 32.3% in France and 31.7% in Sweden. Comparing gross salaries or headline day rates between countries without accounting for that understates the expensive countries and flatters the cheap ones.
An illustration, clearly labelled as one
Suppose a supplier tells you a first implementation is roughly 80 hours of technical work. That hours figure is an assumption for this illustration, not a measured norm — the point is the method, not the number.
At the 2025 sector labour cost, 80 hours represents about €4,680 of employer labour cost in Germany, €2,344 in Poland, and €3,856 at the EU average. Those are what the hours cost to staff, before the supplier has covered anything else or earned anything.
If a German supplier quotes you €14,000 for those 80 hours, the labour base is about a third of it. That is not evidence of overcharging — it is roughly what a sustainable services business looks like. If a supplier quotes €4,500 for the same 80 hours in Germany, the number is at or below the cost of the labour, which means either the hours are wrong, the work is going somewhere cheaper, or someone is buying the logo.
That is the whole use of this table. Not to tell you the right price, but to let you ask a supplier the only question that reliably exposes an unserious quote: how many hours, and where are they worked?
The part that is genuinely cheap and predictable
Buyers routinely assume the AI is the expensive part. On published pricing it is usually the smallest line in the budget.
Per million tokens, verified against the providers' own pricing pages in August 2026:
| Model | Input | Output |
|---|---|---|
| Claude Opus 5 | $5.00 | $25.00 |
| Claude Sonnet 5 | $2.00 | $10.00 |
| Claude Haiku 4.5 | $1.00 | $5.00 |
| GPT-5.6-sol | $4.00 | $20.00 |
| GPT-5.6-terra | $2.00 | $12.00 |
| GPT-5.6-luna | $0.20 | $1.20 |
| GPT-5 | $1.25 | $10.00 |
| GPT-5-mini | $0.25 | $2.00 |
A million tokens is roughly 750,000 words of input. A small business workflow — drafting replies, classifying documents, summarising a mailbox — generally consumes tens of euros a month at these rates, not thousands. Both providers also publish a batch discount of about 50% for work that does not need an immediate answer.
For European buyers there is one regional detail worth knowing: on Amazon Bedrock and Google Cloud, regional and multi-region endpoints carry a 10% premium over global endpoints, and Anthropic's first-party API applies a 1.1x multiplier when inference is pinned to a specific geography. Keeping processing in a chosen region is available, and it costs about a tenth more. Where your data is processed is a separate decision from what it costs — we cover the residency side in where your agent's data actually gets processed.
Why supply differs, and why that matters for your quote
Labour cost is not the only regional difference. Eurostat counted 10.45 million ICT specialists across the EU in 2025 — 5.0% of everyone employed — but the concentration is uneven: 8.9% of the workforce in Sweden, 8.7% in Luxembourg and 7.8% in Finland, against 2.5% in Greece and 2.7% in Romania. Germany alone employs about 2.3 million, roughly 22% of the EU total.
Growth has also slowed: the specialist workforce grew 4.5% between 2023 and 2024, and 2.6% between 2024 and 2025.
The practical consequence is that a low labour cost does not always mean an easily available supplier, and a high labour cost country is not automatically overpriced — it may simply have the people. Supply and price move together, and neither on its own tells you whether a quote is fair.
How to read a quote you have already been given
Five questions turn a quote from a number into something you can check. None of them requires technical knowledge, and a supplier who cannot answer the first two has told you something useful.
- Ask for hours and location. A quote that will not decompose into hours is not a quote, it is a number.
- Divide. Compare the implied hourly figure against your country's row above. If it lands below the labour cost line, something is unstated.
- Ask what the hours cover. Scoping, integration and maintenance are three different budgets. The cost structure of an implementation sets out what each one buys.
- Ask what happens after go-live. Maintenance is where projects quietly become expensive, and it is the line most often missing.
- Treat the model cost as noise. It is real, it is published, and for a small business it is rarely the deciding number.
What this cannot tell you
This page gives you a documented cost base and a method for interrogating a quote. It has clear limits, and they matter:
- It is not a price. Eurostat measures employer labour cost. Margin, overhead, sales cost and risk are not in it and cannot be derived from it.
- It is sector-wide. Information and communication is a broad category. Agent implementation specialists sit above the average.
- It is annual and backward-looking. The 2025 figures were published in April 2026. They will not reflect a rate change that happened this quarter.
- It says nothing about quality. A cheaper country is not a worse supplier, and an expensive one is not a better one. This data cannot make that judgement for you.
- We have not surveyed implementations. No first-party pricing dataset exists behind this page, and we have not invented one. Everything here is published evidence you can open and check yourself, listed in the notes.
Frequently asked questions
What does an AI agent implementation cost in Europe?
No published source gives a credible single figure, and the ranges advertised by suppliers contradict each other by a factor of fifty. What is published is the cost base: Eurostat measured hourly labour cost in the information and communication sector at €48.20 across the EU in 2025, ranging from €24.00 in Bulgaria to €71.70 in Ireland. A quote is that base plus overhead, margin and risk.
Why do AI agent quotes vary so much between countries?
Mostly because labour costs vary. In 2025 an hour of employer labour cost in the sector was €58.50 in Germany, €29.30 in Poland and €24.00 in Bulgaria. That is roughly a threefold spread across the EU for the same category of work.
How much of an AI agent's cost is the AI model itself?
Usually the smallest and most predictable part. Published API pricing in August 2026 runs from $1 to $10 per million input tokens across the main models. For a small business workflow that is typically tens of euros a month. The cost concentrates in human work — scoping, connecting systems, and maintaining them.
Is a cheaper quote from Eastern Europe a worse quote?
Not on this evidence. The labour cost difference is real and documented, so a lower price can reflect the local cost base rather than lower quality. What matters is whether the quote covers the same scope.
Notes
All figures retrieved 2026-08-27.
- Hourly labour cost, information and communication (NACE Rev. 2 section J), 2025 and 2024. Eurostat dataset
lc_lci_lev, Labour cost levels by NACE Rev. 2 activity; unit EUR, structureD1_D4_MD5(compensation of employees plus taxes minus subsidies), annual. Dataset last updated 2026-04-23. 32 reporting countries in 2025; the Netherlands did not report for 2025 and its 2024 figure (€58.00) is deliberately not carried into the 2025 table. - Economy-wide hourly labour costs and non-wage cost share, 2025. Eurostat, Hourly labour costs, Statistics Explained. EU average €34.9; non-wage costs 24.8% of the EU total, 32.3% in France, 31.7% in Sweden. Covers enterprises with 10 or more employees, excluding agriculture and public administration.
- ICT specialists in employment, 2025. Eurostat, datasets
isoc_sks_itsptandisoc_sks_itsps, published 27 May 2026. 10.45 million ICT specialists, 5.0% of EU employment; growth 4.5% (2023–24) and 2.6% (2024–25). - Anthropic model pricing. Published pricing at platform.claude.com, verified 2026-08-27. Batch API at 50% of standard rates; regional and multi-region endpoints on Bedrock and Google Cloud carry a 10% premium over global; first-party pinned inference geography applies a 1.1x multiplier.
- OpenAI model pricing. Published pricing at developers.openai.com, verified 2026-08-27. Batch pricing stated as approximately 50% of standard.
- Advertised implementation ranges. The "$2K–$65K" and "$8K–$400K" figures are taken from titles in the live search result set for AI agent implementation cost, retrieved 2026-08-27. They are cited as evidence that the published record is inconsistent, not as cost estimates. Neither discloses a method or sample.
The 80-hour figure in the worked illustration is an assumed input chosen to demonstrate the method. It is not a measured norm and should not be read as one.